Inequalities in cancer incidence in Wales by socio-demographic characteristics, 2011-2020 technical guide
Introduction
This document provides an overview of the data collection process, data quality and the methodology applied in developing the analysis of inequalities and cancer. It also provides definitions, notes for interpretation, and details of where to find further information on cancer statistics in Wales.
This work was carried out by Public Health Wales’ Welsh Cancer Intelligence and Surveillance Unit (WCISU). Analysis was carried out using the Secure Anonymised Information Linkage (SAIL) Databank based in Swansea University to link cancer incidence and ONS Census data. This work analysed ‘all cancers combined excluding non-melanoma skin cancer (NMSC)’ and four main cancer types: female breast, colorectal (bowel), prostate and lung. ‘Other cancer types’ refers to all cancer types excluding NMSC and those reported separately (i.e. female breast, lung, prostate, and colorectal cancers).
This new analysis was undertaken to link cancer and Census data together in order to identify and analyse a range of variables not previously available when reporting on cancer data in Wales. This work aimed to identify inequalities amongst cancer patients in Wales with different socio-demographic characteristics including ethnicity, occupation, household tenure and overcrowding in households. Investigating different characteristics that could lead to inequalities between cancer patients in Wales is important, particularly as higher rates of cancer are seen in more deprived areas in Wales.
Data sources
WCISU Cancer Registration Data
In accordance with one of the statutory duties of Public Health Wales (PHW), the WCISU’s core function is ‘to undertake the systematic collection, analysis and dissemination of information about the health of the people of Wales, in particular cancer incidence, mortality, and survival’. Critical to this duty is the continuous compilation of the national cancer registry of Wales and the production of annual official statistics on cancer incidence, mortality and survival in the resident population of Wales.
The national cancer registry is a live and dynamic database where data is submitted to the WCISU from a range of health care providers and associated services. The WCISU collate and validate the data for each patient, defined as the cancer registration minimum dataset.
Cancer incidence
An incident case of cancer is a newly diagnosed case of a malignant neoplasm: cancers described by the World Health Organisation (WHO) International Classification of Diseases (ICD) as ICD-10 codes C00 to C97 excluding C44.
Note: Secondary tumours and recurrences of a previous cancer are not counted as new incident cases.
Outputs are presented by single (2020) or ten-year (2011-2020) periods for men, women and persons diagnosed between 2011 and 2020 for all cancers excluding NMSC for the whole of Wales.
A list of the cancer types, with accompanying ICD-10 codes, reported on in this publication can be found in the Appendix.
Cancer staging
Great strides have been made to improve the completeness of cancer staging data, allowing cancer by stage in Wales to be presented from 2011.
Stage at diagnosis refers to the size of a tumour and how far it has spread from where it originated. Stage is measured from 1 to 4; stage 1 indicates that the cancer is small and has not spread anywhere, whereas stage 4 indicates the cancer has spread to at least one other body organ. Stage 1 and stage 2 are usually referred to as early stage, whereas stage 3 and stage 4 are referred to as late stage at diagnosis. Cases of cancer recorded on the cancer registry may have an unknown stage for many reasons. Firstly, not all types of cancers can be staged (a minority). Of those cancer sites that can be staged, then the stage at diagnosis may be unknown for some of the following reasons: patients might be too ill or turn down diagnostic tests to allow clinical staging. In addition, there might be insufficient clinical data received to be able to derive cancer registry stage.
Stage grouping in this report refers to overall TNM stage grouping. From 2018, the majority of cancer types are staged in TNM version 8. Female genital tract cancer also uses FIGO staging which can usually be mapped directly to TNM stage. A change in TNM version can result in a noticeable redistribution between stage groups for some tumour sites, for example, TNM version 7 was introduced in 2016 which resulted in an increase in stage 1 and a reduction in stage 2 for prostate cancers.
In March 2024, changes were implemented in the national cancer registry database to improve the handling of stage fields. The key update was the consolidation of the STAGE_BEST and STAGE_PI_DETAIL fields into a single field for diagnoses 2013 onwards. To ensure consistency in reporting stage across UK publications, STAGE_BEST now only contains stage values for tumours considered stageable by the United Kingdom and Ireland Association of Cancer Registries (UKIACR) Performance Indicators (PIs). As a result of these changes, a small number of cases that previously appeared staged in groups 1-4 may now appear as stage unknown.
Datasets and analysis
An extract of the data held by the WCISU is sent annually to the SAIL databank for the data to be used in anonymised form by researchers. The extract that was used to identify cancer cases for this analysis contained cancer diagnoses made up to and including 2020.
ICD-10 coding system changes
ICD-10 coding for cancer is based on the nature and anatomical site of the cancer. Previous WCISU Official Statistics publications mapped to and reported on ICD-10v0 for all diagnosing years. However, publications from 2022 onwards will report on ICD-10v0 for diagnosing years 2001 to 2012, and ICD-10v4 from 2013 onwards.
The change in reporting of ICD-10 from 2013 onwards should also be taken into consideration when examining data.
Secure anonymised information linkage (SAIL) databank
The SAIL databank is a trusted research environment (TRE) hosted by Swansea University. Set up in 2007, it is a safe, secure environment for users to access anonymised and linkable data for research in the public interest. Data from SAIL undergoes a rigorous approval process to ensure safe handling of data and the SAIL databank adheres to the internationally recognised Five Safes Framework for a TRE (see legislation section for more information).
In addition to holding health data, such as that provided by the WCISU, SAIL contains administrative data both at a local and all Wales level. At the time of carrying out this analysis, the most recent Census data available within SAIL was from the 2011 Census.
The SAIL databank allows linkage of multiple datasets through the use of the anonymised linking field (ALF). This is a person unique identifier which is assigned to individuals within datasets. This identifier enables secure, anonymous linkage of records across multiple datasets.
SAIL ethnicity spine
The ethnicity spine for Wales was created in a study led by Population Data Science at Swansea University. It is a data table which uses multiple sources to ensure reliability and was shown to be comparable to the 2011 Census reporting. The SAIL ethnicity spine table includes the ALF which allows it to link to other data brought into SAIL such as WCISU cancer registration data.
ONS
Census
The Census is undertaken by the Office for National Statistics (ONS) every 10 years and gives a picture of all the people and households in England and Wales. The Census asks questions about people, their household and their home. In doing so, it helps to build a detailed snapshot of society.
At the time of analysis, the 2011 Census was the latest available within the SAIL databank and was used to conduct this analysis. Census 2021 was used to calculate population breakdowns by age and sex for each characteristic (where possible) to calculate age-standardised rates (ASRs), using standard European populations (see Appendix), for cancer patients diagnosed in 2020.
Data linkage
This work was carried out by anonymous linkage of WCISU cancer registry data to individual level 2011 Census (ONS) data within the SAIL databank based in Swansea University. These datasets were linked using the ALF (see secure anonymised information linkage (SAIL) databank section for more information).
Multiple tables from WCISU and ONS were used and linked together to carry out this analysis. WCISU cancer registry data was used to identify malignant primary cancer cases in Wales between 2011 and 2020. The 2011 Census data was used to identify ethnicity, household tenure, number of bedrooms per household and occupation information. The SAIL ethnicity spine was used to further link to ethnicity data for any initial unmatched or missing Census cases after first linking to 2011 Census data. The tables used from each of these sources are listed below:
WCISU
- SAIL1540V.C19_COHORT_WCSU_ALF
- SAIL1540V.C19_COHORT_WCSU_NEOPLASM
2011 Census
- SAIL1540V.CENW_CENSUS_WALES_ALF_2011_20200610
- SAIL1540.CENW_CENSUS_PER_HH_FAM_WALES_2011
SAIL ethnicity spine
- SAILW1540V.RRDA_ETHN
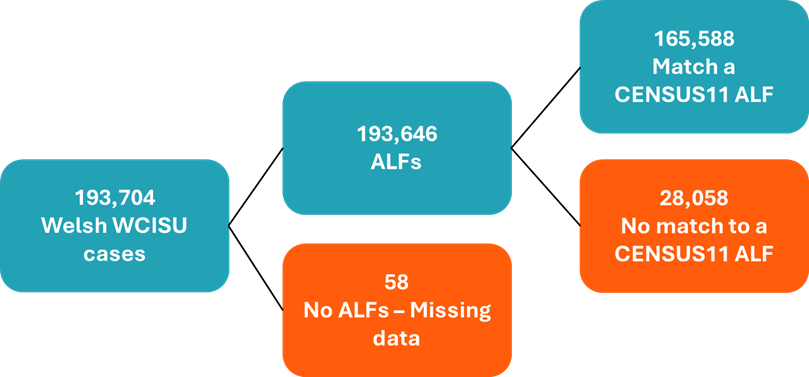
Once data linkage between these tables was complete, 85% of cancer cases
matched to 2011 Census data (Figure 1). Where there were duplicate matches, the
most complete 2011 Census record was chosen based on the variables analysed. Any
cases not matched on household tenure, occupation or overcrowding were assigned to the unmatched/unknown category. Overall, 165,588 cases of cancer in Wales matched to 2011 Census data using the ALF whilst 28,058 could not be matched.
Figure 1: Data linkage process of joining WCISU cancer incidence data to ONS 2011 Census data using the ALF, and the corresponding number of matched and unmatched cases
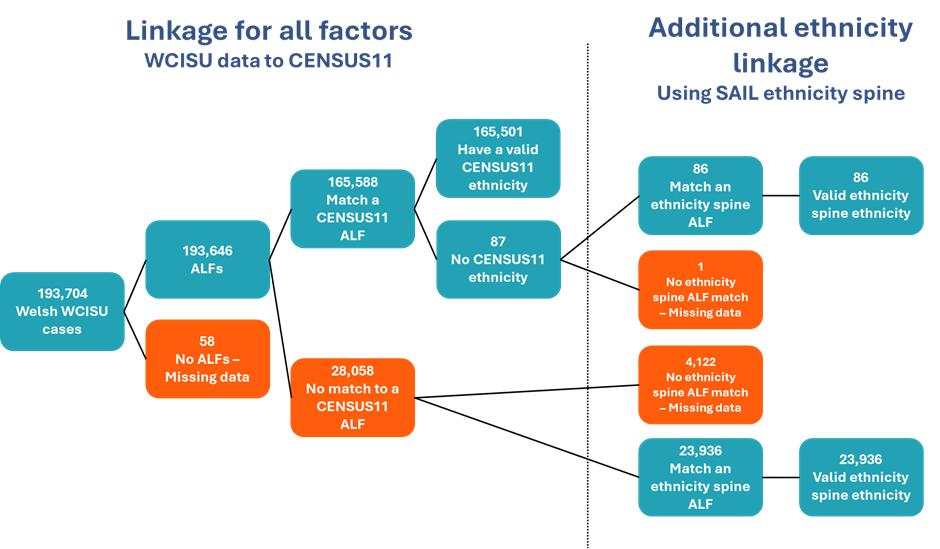
SAIL ethnicity spine linkage
For ethnicity, further information for cases that had not been matched at this point
in the analysis was also available within the SAIL ethnicity spine (see SAIL ethnicity spine section for more information on the ethnicity spine), so further matching was attempted
(Figure 2). Ethnicity identified in the 2011 Census was used first and then any
unknowns or unmapped cases were linked to the ethnicity spine on ALFs and the
ethnicity used from there. Figure 2 shows how linkage for all factors (ethnicity, household tenure, overcrowding and occupation) occurred, followed by the additional ethnicity linkage that occurred using the SAIL ethnicity spine.
The ALF was used to link the cancer data to the ethnicity spine with good success. 85% of the cancer cases mapped to a 2011 Census record for ethnicity and 97.8% mapped to the ethnicity spine, resulting in only 4,181 cases (2%) having no recorded ethnicity. In our analysis, the ethnicity spine table was used for the 12.4% of cancer cases where there was no ethnicity recorded in the 2011 Census data or where the case did not map to a 2011 Census record.
Some mismatches were found between Census data and the ethnicity spine table, possibly due to people identifying as different ethnicities at different stages of their lives. Some patients were also found to have multiple Census cases linked to them using the ALF so the case with the most populated data was used for those patients if this occurred. Therefore, some age and sex mismatches did also occur between the cancer registry data and the Census data.
Figure 2: The additional data linkage process for ethnicity linkage to WCISU cancer incidence data using the SAIL
ethnicity spine, and the corresponding number of final matched and unmatched cases
Data fields
The 2011 Census fields which were used within the SAIL environment to link Census
data to cancer incidence data were:
| Indicator | 2011 Census Field |
|---|---|
| Ethnicity |
ETHPUK11 ETHN_EC_ONS_DATE_LATEST_DESC (Ethnicity spine) |
| Overcrowding |
RESIDENCE_TYPE = “H” PPBROOMHEW11 |
| Household tenure |
RESIDENCE_TYPE = “H” TENHUK11 |
| Occupation |
ECOPUK11 OCCPUK113 |
Both the overcrowding and household tenure fields were filtered to exclude those living in communal establishments, such as student halls of residence, care homes, prisons, hospitals and armed forces establishments. For overcrowding, the PPBROOMHEW11 field was used to filter for the different number of bedrooms within households recorded in the 2011 Census. For household tenure, the TENHUK11 field was then filtered to include various types of household tenure.
The occupation field was filtered to exclude students and was split into those who
were economically active and those who were retired using the ECOPUK11 field.
Census 2021 was used to determine the denominator when calculating rates. For household tenure, the Census 2021 categories had changed slightly so the types of household tenure were re-grouped into four broader categories to enable calculation of rates for this indicator. Occupation was then categorised using the OCCPUK113 field.
Categorisation of socio-demographic characteristics
Ethnicity
Ethnicity is defined as the quality or fact of belonging to a population or sub-group made up of people who share a common descent or cultural background. Within the Census, the ethnicity indicator classifies people according to their own perceived ethnic group and cultural background.
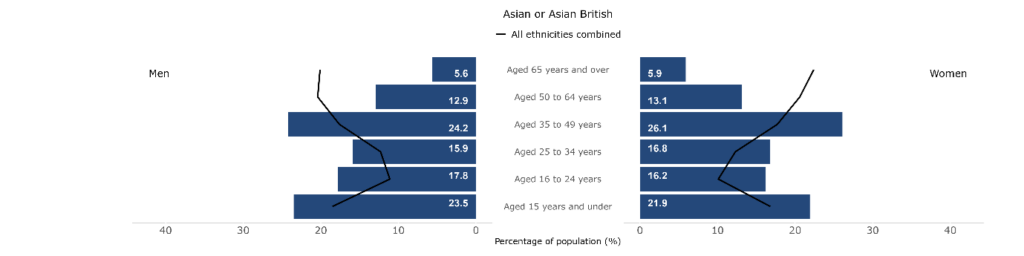
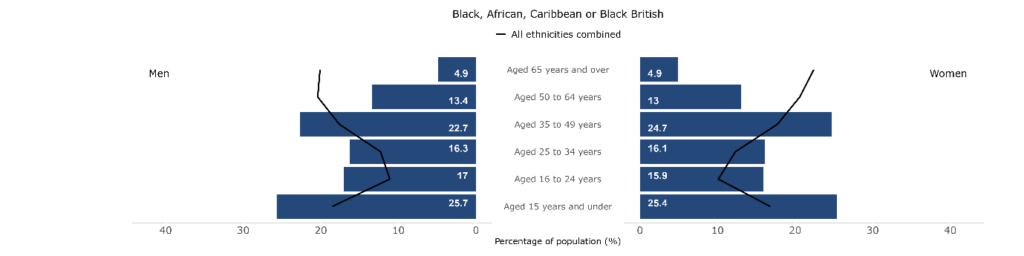
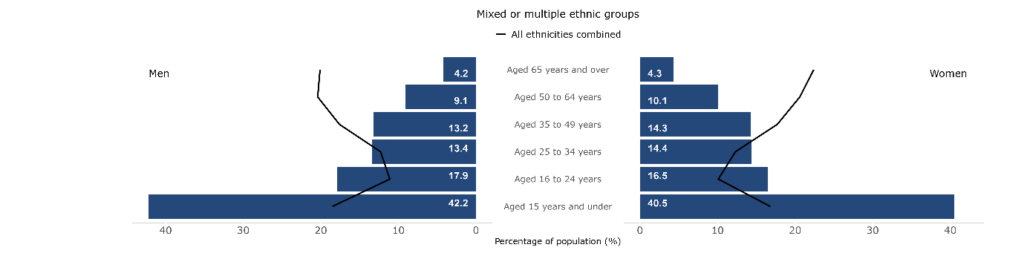
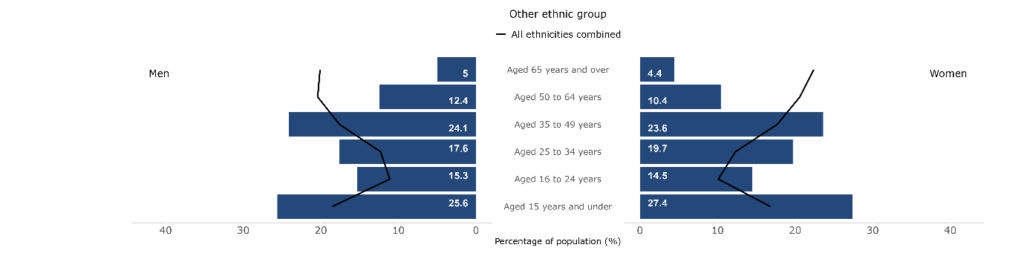
The ethnic categories recorded by the Census can be seen in the table below. These categories were used to identify and create six broad ethnic groups for our analysis:
| ONS ethnicity classification | PHW broad ethnic groups |
|---|---|
|
English/Welsh/Scottish/Northern Irish/British Irish Gypsy or Irish Traveller Other White |
White |
|
White and Black Caribbean White and Black African White and Asian Other Mixed |
Mixed/Multiple ethnic groups |
|
Indian Pakistani Bangladeshi Chinese Other Asian |
Asian/Asian British |
|
African Caribbean Other Black |
Black/African/Caribbean/Black British |
|
Arab Other Ethnic Group |
Other ethnic groups |
| Unknown/unmatched ethnicity |
Statistics
Listed here are the various statistics that were calculated for this indicator.
Counts
Counts were calculated for all of the statistics below. Counts were also calculated for cancer incidence by sex, ethnic group and cancer type for ages:
- Less than 35 years
- 36-49 years
- 50-64 years
- 65+ years
Crude rates
Crude rates were calculated for each broad ethnic group by every cancer analysed i.e. all cancers excluding NMSC, female breast, colorectal, lung and prostate, for persons of all ages at an all Wales level for the year 2020.
Age-standardised rates
Age-standardised rates and corresponding 95% confidence intervals were calculated for each broad ethnic group by every cancer analysed for persons of all ages at an all Wales level for the year 2020. European age-standardised weightings were used (see Appendix).
Proportions
A number of proportions (%) and their corresponding 95% confidence intervals were calculated for different breakdowns of the data. Every proportion was calculated for the ten-year period 2011-2020.
Ethnicity numerator and denominator
The numerator used for calculation of proportions for ethnicity was the number of people diagnosed with cancer between 2011 to 2020 in a specific ethnic group recorded in the 2011 Census.
The numerator used for calculation of rates for ethnicity was the number of people diagnosed with cancer in 2020 in a specific ethnic group recorded in the 2011 Census.
The denominator used for calculation of proportions for ethnicity was the number of people diagnosed with cancer between 2011 and 2020.
The denominator used for calculation of rates for ethnicity was the number of people in a specific ethnic group recorded in Census 2021.
Where further breakdowns were made for proportions, for example by age or cancer type, the numerator was the number of people in a specific ethnic group with that extra characteristic (e.g. aged 50-64 or diagnosed with colorectal cancer) while the denominator was the total number of people in that ethnic group.
Overcrowding by number of bedrooms
Overcrowding is defined as the presence of more people in a space than is comfortable, safe, or permissible. The Census records the number of persons per bedroom in a household and this indicator was used in this work to analyse overcrowding in households in Wales. The Census defines the number of persons per bedroom in household as follows:
The number of persons per bedroom is equal to the number of usual residents in a household divided by the number of bedrooms in that household’s accommodation. A bedroom is defined as any room that was intended to be used as a bedroom when the property was built, or any room that has been permanently converted for use as a bedroom. It also includes all rooms intended for use as a bedroom even if not being used as a bedroom at the time of the Census.
Overcrowding was measured by looking at the ratio of the number of people in a household to the number of bedrooms within that residence.
The 2011 Census classifications and subsequent classifications by WCISU for overcrowding were as follows:
| ONS classification | PHW overcrowding groups |
|---|---|
| Up to 0.5 persons per bedroom | Two or more spare bedrooms |
| Over 0.5 and up to 1.0 persons per bedroom | One spare bedroom |
| Over 1.0 and up to 1.5 persons per bedroom | Standard number of bedrooms |
| Over 1.5 persons per bedroom | Fewer bedrooms than required |
| – | Unknown/unmatched |
Those living in communal establishments such as care homes were excluded.
Statistics
Listed here are the various statistics that were calculated for this indicator.
Counts
Counts were calculated for all of the statistics below. Counts were also calculated for cancer incidence by sex, number of bedrooms and cancer type for ages:
- Less than 25 years
- 26-34 years
- 35-49 years
- 50-64 years
- 65+ years
Crude rates
Crude rates and corresponding 95% confidence intervals were calculated for each overcrowding group by every cancer analysed for men, women and persons of all ages at an all Wales level for the year 2020.
Age-standardised rates
Age-standardised rates and corresponding 95% confidence intervals were calculated for each overcrowding group by every cancer analysed for men, women and persons of all ages at an all Wales level for the year 2020. European age-standardised weightings were used.
Proportions
A number of proportions (%) and their corresponding 95% confidence intervals were calculated for different breakdowns of the data. Every proportion was calculated for the ten-year period 2011-2020.
Overcrowding numerator and denominator
The numerator used for calculation of proportions for overcrowding was the number of people diagnosed with cancer between 2011 to 2020 in a specific overcrowding group.
The numerator used for calculation of rates for overcrowding was the number of people diagnosed with cancer in 2020 in a specific overcrowding group.
The overcrowding groups were assigned by looking at the ratio of the number of people in a household to the number of bedrooms as recorded in the Census.
The denominator used for calculation of proportions for overcrowding was the number of people diagnosed with cancer between 2011 and 2020.
The denominator used for calculation of rates for overcrowding was the number of people in a specific overcrowding group recorded in Census 2021.
Where further breakdowns were made for proportions, for example by age or cancer type, the numerator was the number of people in a specific overcrowding group with that extra characteristic (e.g. aged 50-64 or diagnosed with colorectal cancer) while the denominator was the total number of people in that overcrowding group.
Household tenure
Tenure refers to whether a household owns or rents their private dwelling, and is recorded by the Census. If rented, it combines this with information about the type of landlord who owns or manages the accommodation.
The tenure categories recorded in the Census and used in the analysis can be seen in the table below. For some of the analysis, the Census classifications were used but for other parts, the Census categories were combined into four broader groups. Those living in communal establishments such as care homes were excluded.
| ONS classification | PHW broad household tenure groups |
|---|---|
| Owned: Owned outright | Owned outright |
|
Owned: Owned with a mortgage or loan Shared ownership (part owned or part rented) |
Owned with mortgage/Loan/Shared ownership |
|
Social rented: Rented from council (local authority) Social rented: Other social rented |
Social rented |
|
Private rented: Private landlord or letting agency Private rented: Employer of a household member Private rented: Relative or friend of household member Private rented: Other Living rent free |
Private rented/Living rent free |
| – | Unknown/Unmatched |
Statistics
Listed here are the various statistics that were calculated for this indicator.
Counts
Counts were calculated for all of the statistics below. Counts were also calculated for cancer incidence by sex, household tenure and cancer type for ages:
- Less than 35 years
- 36-49 years
- 50-64 years
- 65+ years
Crude rates
Crude rates and corresponding 95% confidence intervals were calculated for each type of household tenure by every cancer analysed for men, women and persons of all ages at an all Wales level for the year 2020.
Age-standardised rates
Age-standardised rates and corresponding 95% confidence intervals were calculated for each broad household tenure group by every cancer analysed for men, women and persons of all ages at an all Wales level for the year 2020. European age-standardised weightings were used.
Proportions
A number of proportions (%) and their corresponding 95% confidence intervals were calculated for different breakdowns of the data. Every proportion was calculated for the ten-year period 2011-2020.
Household tenure numerator and denominator
The numerator used for calculation of proportions for household tenure was the number of people diagnosed with cancer between 2011 to 2020 with a specific household tenure group recorded in the 2011 Census.
The numerator used for calculation of rates for household tenure was the number of people diagnosed with cancer in 2020 with a specific household tenure group recorded in the 2011 Census.
The denominator used for calculation of proportions for household tenure was the number of people diagnosed with cancer between 2011 and 2020.
The denominator used for calculation of rates for ethnicity was the number of people in a specific household tenure group recorded in Census 2021.
Where further breakdowns were made for proportions, for example by age or cancer type, the numerator was the number of people in a specific household tenure group with that extra characteristic (e.g. aged 50-64 or diagnosed with colorectal cancer) while the denominator was the total number of people in that household tenure group.
Occupation
As defined by the Census, a person’s occupation relates to their main job and is derived from either their job title or details of the activities involved in their job. This indicator is used to assign responses to the Census to an occupation code based on the Standard Occupational Classification (2010). For this work, the Census occupational classifications seen in the table below were used for analysis. In this analysis, two groups of people were analysed for every occupational classification: those retired from a former occupation (retirees), and those economically active at the time of the Census.
| ONS occupation classification |
|---|
| Managers, directors and senior officials |
| Professional occupations |
| Associate professional and technical occupations |
| Administrative and secretarial occupations |
| Skilled trades occupations |
| Caring, leisure and other service occupations |
| Sales and customer service occupations |
| Process, plant and machine operatives |
| Elementary occupations |
People under the age of 16, people who have never worked, and students were excluded. An unknown/unmatched category was also analysed for incident cancer cases that could not be matched to an occupational group. This was included for both retirees and active occupation.
The active occupation group was classified as people who were working at the time of the Census so their current listed occupation in the 2011 Census was assigned to them.
The retired occupation group was classified as people who were retired at the time of the Census, so their occupation pre-retirement, as collected by the 2011 Census, was assigned to them.
Statistics
Listed here are the various statistics that were calculated for this indicator. All statistics were calculated for both retirees and those who were economically active.
Counts
Counts were calculated for all of the statistics below.
Counts were calculated for cancer incidence by sex, retired occupation and cancer type for ages:
- Less than 65 years
- 65+ years
Counts were also calculated for cancer incidence by sex, active occupation and cancer type for ages:
- 16-34 years
- 35-49 years
- 50-64 years
- 65+ years
Crude rates
Crude rates were calculated for each occupation for all cancers excluding NMSC, colorectal and lung cancer, for persons of all ages at an all Wales level for the year 2020. Prostate and female breast cancer were excluded as populations could not be attained by sex in order to calculate the rates for these sex-specific cancer types.
Proportions
A number of proportions (%) and their corresponding 95% confidence intervals were calculated for different breakdowns of the data. Every proportion was calculated for the ten-year period 2011-2020 or for the single-year period 2011.
Occupation numerator and denominator
The numerator used for calculation of proportions for occupation was the number of people diagnosed with cancer between 2011 to 2020 in an occupation group recorded in the 2011 Census.
The numerator used for calculation of rates for occupation was the number of people diagnosed with cancer in 2020 in an occupation group recorded in the 2011 Census.
The denominator used for calculation of proportions and for occupation was the number of people diagnosed with cancer between 2011 and 2020.
The denominator used for calculation of rates for occupation was the number of people in a specific occupation group recorded in Census 2021.
Where further breakdowns were made for proportions, for example by age or cancer type, the numerator was the number of people in a specific occupation group with that extra characteristic (e.g. aged 50-64 or diagnosed with colorectal cancer) while the denominator was the total number of people in that occupation group.
Notes and caveats
The cancer diagnosis data covers diagnosis years 2011 to 2020, with cases being assigned variables based on the 2011 Census. For the calculation of crude and age-standardised rates, the numerator counts were based on 2020 cancer diagnoses linked to the 2011 Census (and ethnicity spine), and denominator counts based on Census 2021 results as it was the only available data. As some demographic characteristics can change over a 10-year period, the different timeframes for each dataset should be considered when interpreting the results.
Age-standardised rates were calculated using the same methodology used in our cancer incidence, mortality and survival Official Statistics, so the standard populations used for analysis were European (see Appendix).
For household tenure rates, the Census 2021 categories had changed slightly compared to the 2011 Census so the types of household tenure were re-grouped into four broader categories to enable calculation of rates for this indicator.
For the occupation rates, age and sex by occupation could not be attained from Census 2021 data so only crude rates could be calculated as age and sex breakdowns are needed to calculate age-standardised rates. Due to this, for occupation, prostate and female breast cancer were also excluded as rates could not be calculated for these sex-specific cancer types. Secondly, the questions in Census 2021 for occupation changed slightly compared to the 2011 Census so the occupation fields needed for analysis and data linkage differed and were not directly comparable.
Reported measures
Count
The incidence count is the number of cancers diagnosed over a particular period of time.
Crude rates
A crude rate (CR) is the number of events occurring in a population over a specific time period, often expressed as the number of events per 100,000 of the population. Both the numerator (number of events) and denominator (mid-year population estimate) should be based on the same geographical area and time period. However, for this analysis, it was not possible to use the same source for both the numerator and denominator. The numerator is based on information from the 2011 Census applied to cancer diagnoses for 2011-2020, whilst the denominator used results from Census 2021. As a result, caution is advised when interpreting results.
The crude rate is defined as total registrations per 100,000 population, or:
Crude rates are supressed where there were fewer than three events.
Age-standardised rates
The incidence and mortality of cancer differs greatly with age. Differences in the age structure of populations between geographical areas or over time therefore need to be controlled to give unbiased comparisons. Age-standardisation allows comparison of rates across different populations while taking account of the different age structures of those populations.
This is achieved by applying the observed age- and sex-specific incidence or mortality rates for each population to a standard population. These are then summed to give an overall rate per 100,000 population.
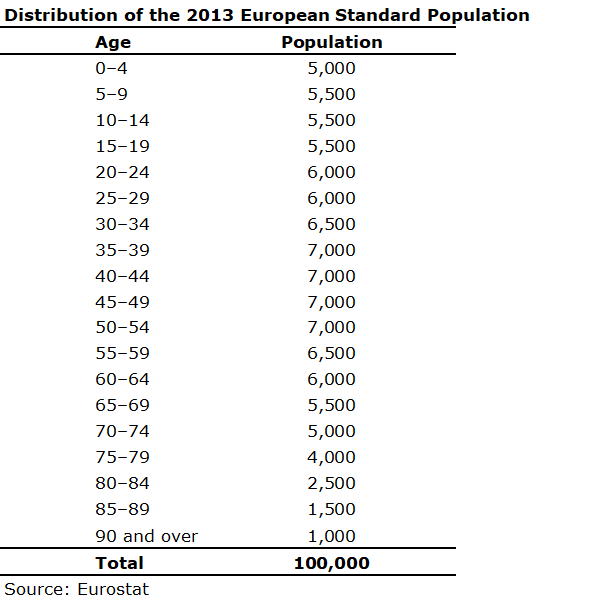
The standard population used here is the European Standard Population (ESP) (see Appendix). The first version of the ESP was introduced in 1976, with the second version in 2013. All the WCISU publications since June 2014 have used the 2013 ESP.
Age-standardised rates are supressed where there were fewer than 10 events.
The directly standardised mortality rate using the European Standard Population is given by:
where:
- = the observed incidence/mortality rate in age group k
- = registrations in age group k
- = population in age group k
- = 0-4, 5-9, …, 85-89, and 90 and over
- = European standard population in age group k
The 2013 European Standard Population distribution can be found in the Appendix.
Proportions
Proportions are calculated when reporting on staging and measures for which it is not possible to calculate a rate. The sum of all categories should sum to 1 for all breakdowns reported.
Proportions can take values between 0 and 1, and are defined by having:
- A numerator in which every individual known to be in the denominator is counted once or not at all
- A denominator which is exactly defined and known, and in which every individual is counted only once
In such instances, the denominator is considered to be a ‘closed’ population.
Analysis reporting proportions or percentages are displayed as percentages in the output, with proportions simply multiplied by 100 to convert to a percentage (%).
Confidence intervals
Confidence intervals are produced alongside ASRs, crude rates and proportions. They are indications of the natural variation that would be expected around an estimate and should be considered when assessing or interpreting an estimate. The size of the confidence interval is dependent on the number of events occurring and the size of the population from which the events came. Generally, estimates based on small numbers of events and small populations are likely to have wider confidence intervals. Conversely, estimates based on large populations are likely to have narrower confidence intervals.
In this publication, we calculate 95 per cent confidence intervals. This represents a range of values that we can be 95 per cent confident contains the ‘true’ underlying estimate.
Confidence intervals calculated alongside EASRs use the modified gamma distribution method by Tiwari, R.C. et al. (2006). This is a modification of the formula for the upper confidence limit of the original confidence intervals for directly standardised rates based on the gamma distribution, as proposed by Fay and Feuer (1997). Confidence intervals are presented alongside proportions using a method proposed by Wilson, E.B. et al. (1927).
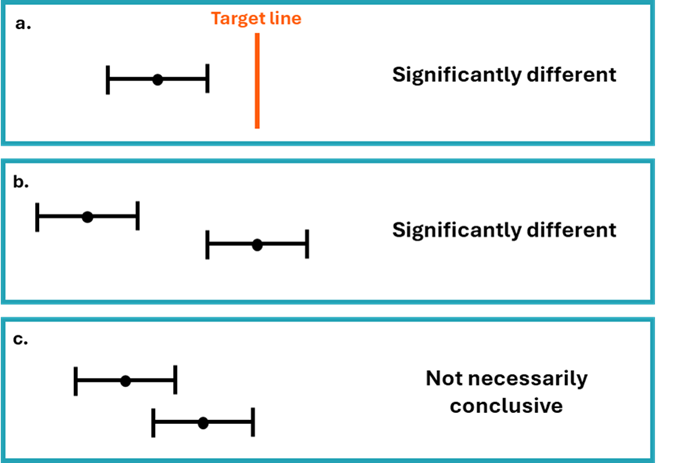
Comparisons are often made between two or more estimates, for example, between different areas or time periods (Figure 3). Sometimes in such cases statistical testing is undertaken by comparing the confidence intervals of the estimates to see if they overlap. Non-overlapping confidence intervals are considered as statistically significantly different. Whilst it is safe to assume that non-overlapping confidence intervals indicate a statistically significant difference, it is not always the case that overlapping confidence intervals do not (Figure 3). A more exact approach is to calculate the ratio of the two estimates, or the difference between them, and construct a test or confidence interval based on that statistic. Such methods are not covered in this technical guide but can be found in a standard textbook.
Figure 3: Using confidence intervals for making comparisons
Populations
In this publication, populations were developed using Census 2021. Responses to questions on ethnicity, number of bedrooms, household tenure and occupation determined the population size of each of these groups. Only Welsh residents were included in these groupings.
Further information on the populations used for each indicator can be found in the relevant sections for ethnicity, overcrowding, household tenure and occupation.
Accessibility and clarity
The statistics will be published in an accessible, orderly manner on the WCISU website on the day of publication. We also publicise the outputs to our stakeholders via email. All outputs are available and free to download. This publication is presented in an HTML format with embedded images for charts and tables. All images will have alternative text available for use by screen readers and similar technology.
We aim to use plain English in our outputs, and they adhere to the Public Health Wales’s accessibility policy. Furthermore, all our statistics are published in Welsh and English. Further information regarding the statistics can be obtained by emailing [email protected].
Legislation
Under the Data Protection Act, the lawful processing of patient/service user data for purposes other than that necessary for the direct provision of care requires one of the following conditions to be met:
- Explicit patient/service user consent for processing
- Explicit authorisation by statute
- Approval under Section 251 of the NHS Act 2006
Public Health Wales undertakes a number of activities that cannot be classed as direct care, but where the obtaining explicit consent would be impractical or would compromise the integrity of the relevant activity. Examples include:
- Evaluation of screening programmes
- Cancer registration
- Registration of congenital anomalies
So called ‘Section 251’ approval, therefore, remains the most appropriate means of ensuring that Public Health Wales complies with the Data Protection Act when undertaking such processing. Such approval needs to be obtained for new activities and renewed annually for existing activities.
Section 251 was established to provide a secure legal basis for the disclosure and processing of confidential information in the NHS where it is not possible to use anonymised information or to obtain explicit consent. A mechanism was established to enable the Secretary of State for Health to exercise powers of approval under Section 251, advised by the National Information Governance Board (NIGB) and its Ethics and Confidentiality Committee (ECC). The mechanisms operated by NIGB and its ECC also applied to Wales.
Under General Data Protection Regulation (GDPR), we follow:
- Article 6 (1) e – processing is necessary for the performance of a task carried out in the public interest or in the exercise of official authority vested in the controller
- Article 9 (2) h – processing is necessary for the purposes of preventive or occupational medicine, for the assessment of the working capacity of the employee, medical diagnosis, the provision of health or social care or treatment or the management of health or social care systems and services on the basis of Union or Member State law or pursuant to contract with a health professional and subject to the conditions and safeguards referred to in paragraph 3
The key policy on cancer in Wales is set out in the Wales Cancer Network’s Cancer improvement plan 2023-2026.
The Well-being of Future Generations Act 2015 is about improving the social, economic, environmental, and cultural well-being of Wales. The Act puts in place seven well-being goals for Wales. These are for a more equal, prosperous, resilient, healthier, and globally responsible Wales, with cohesive communities and a vibrant culture and thriving Welsh language. Under section (10) (1) of the Act, the Welsh Ministers must:
- publish indicators (“national indicators”) that must be applied for the purpose of measuring progress towards the achievement of the Well-being goals
- lay a copy of the national indicators before the National Assembly. The 46 national indicators were laid in March 2016
Further information on the Well-being of Future Generations (Wales) Act 2015.
The statistics included in this release could also provide supporting narrative to the national indicators and be used by public services boards in relation to their local well-being assessments and local well-being plans.
In this publication, the WCISU adhered to disclosure control guidance set out within the SAIL databank TRE, where any counts less than ten being suppressed.
TREs follow the Five Safes Framework which is a set of principles which enable data services to provide safe research access to data. This framework is best practice in data protection whilst fulfilling the demands of open science and transparency. Further information on the Five Safes Framework can be found here.
Glossary
- ALF – Anonymised Linking Field
- ASR – Age-standardised rate
- EASR – European age-standardised rate
- ECC – Ethics and Confidentiality Committee
- ENCR – European Network of Cancer Registries
- ESP – European standard population
- FIGO – International Federation of Gynaecology and Obstetrics
- GDPR – General Data Protection Regulation
- ICD – International Classification of Diseases
- MYE – Mid-year population estimates
- NHS – National Health Service
- NIGB – National Information Governance Board
- NMSC – Non-melanoma skin cancer
- ONS – Office for National Statistics
- PHW – Public Health Wales
- PI – Performance indicator
- SAIL – Secure Anonymised Information Linkage
- TNM – TNM Classification of Malignant Tumours
- TRE – Trusted Research Environment
- UKIACR – United Kingdom and Ireland Association of Cancer Registries
- WCISU – Welsh Cancer Intelligence and Surveillance Unit
- WHO – World Health Organisation
Appendix
Cancer type map
| Site name | ICD-10 code |
|---|---|
| All cancers combined excluding NMSC | C00-C97 exc. C44 |
| Colorectal cancer | C18-C20 |
| Lung cancer | C33-C34 |
| Female breast cancer | C50 |
| Prostate cancer | C61 |
| Other cancer types | C00-C97 exc. C44, C18-C20, C33-C34, C50, C61 |
European standard populations
Population breakdowns for each ethnic group analysed by sex and age group in Wales, 2021